Manufacturing x Optimum
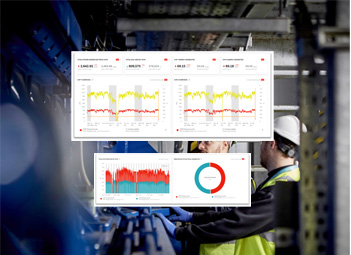
Optimum provides the data and insight required to make changes that will boost your resilience and increase profitability. Discover how we’ve helped customers in the manufacturing sector use optimum to manage energy use and cut costs.
Simply click on the hot spots to read our manufacturing industry use cases.


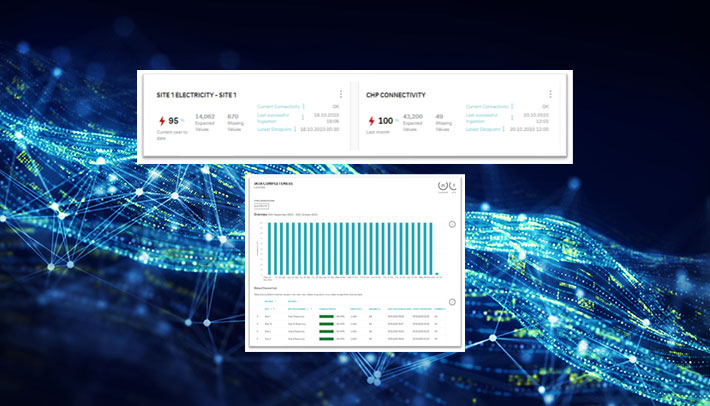


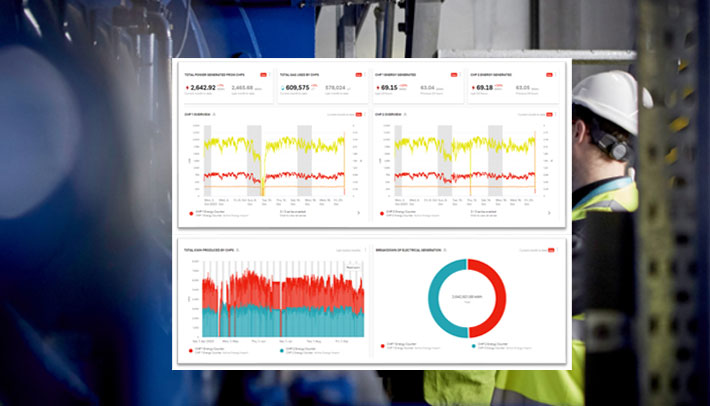
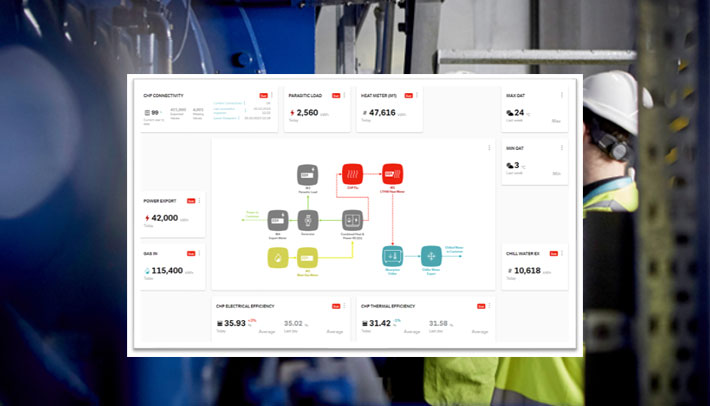


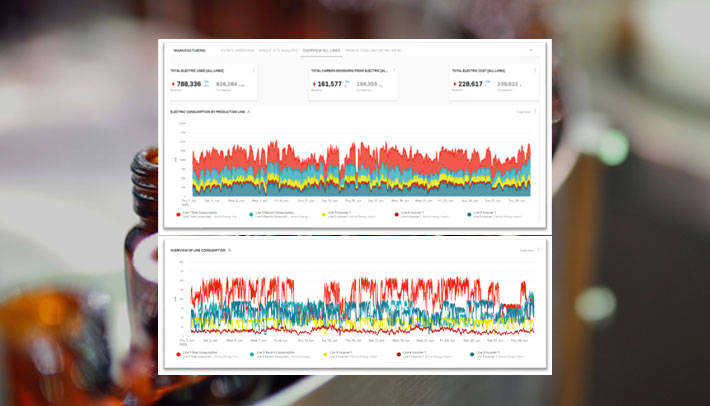
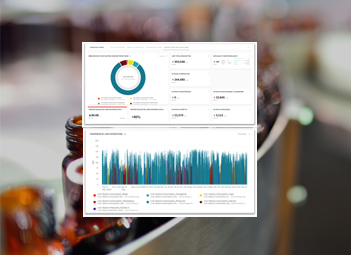
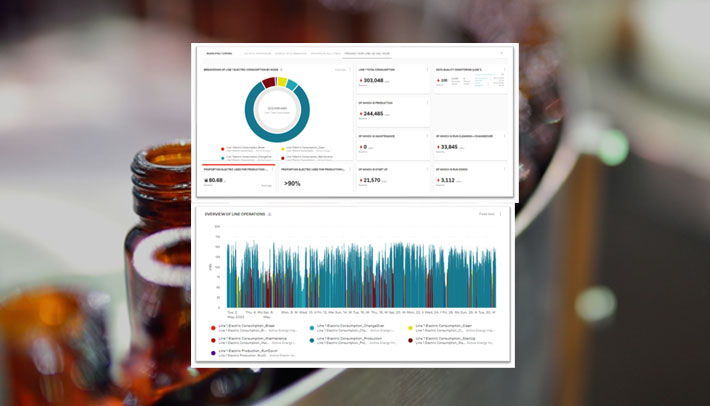
Giving manufacturers a boost with Optimum...


More ways to stay in control of your energy...


From our flexible usage solutions to our energy efficiency consultancy, we'll help you understand your energy use. Allowing you to improve your efficiency and profit from your flexibility.


Transform your site with our energy efficient lighting solutions, save energy usage and cut costs and increase sustainability.
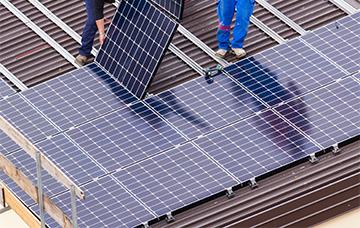
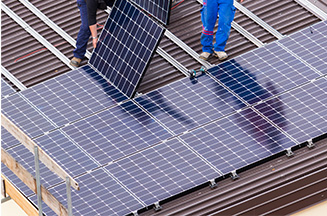
Generate your own energy with solar photovoltaic panels and use the sun's energy to power your business, whilst benefiting from savings on your energy bills and reduced carbon emissions.